Network Performance Monitor (NPM)
Reduce network failure with your data
Become a reseller
In business since 2004, blësk has entered the market as the solution of choice for network monitoring.

Key advantages
- Automatic Device Detection
- Saturation Forecast
- Ranking of Interface Ports
- 30 Seconds Interval Accuracy
- Graphic Representation
How can you quickly improve the visibility of your network performance while identifying bandwidth issues and bottlenecks? A common practice is to monitor network traffic by polling a network switch or router interface using Simple Network Management Protocol (SNMP).
blësk Network Performance Monitor (NPM) improves the performance and health of your network. It is used to trace serial data such as CPU load or the use of bandwidth. It collects, analyzes, and measures performance data for SNMP compliant devices in near real time.
High-performance, industry-standard graphical data system for chronological data

Reduce Network Failures and Improve the Performance of your Environment
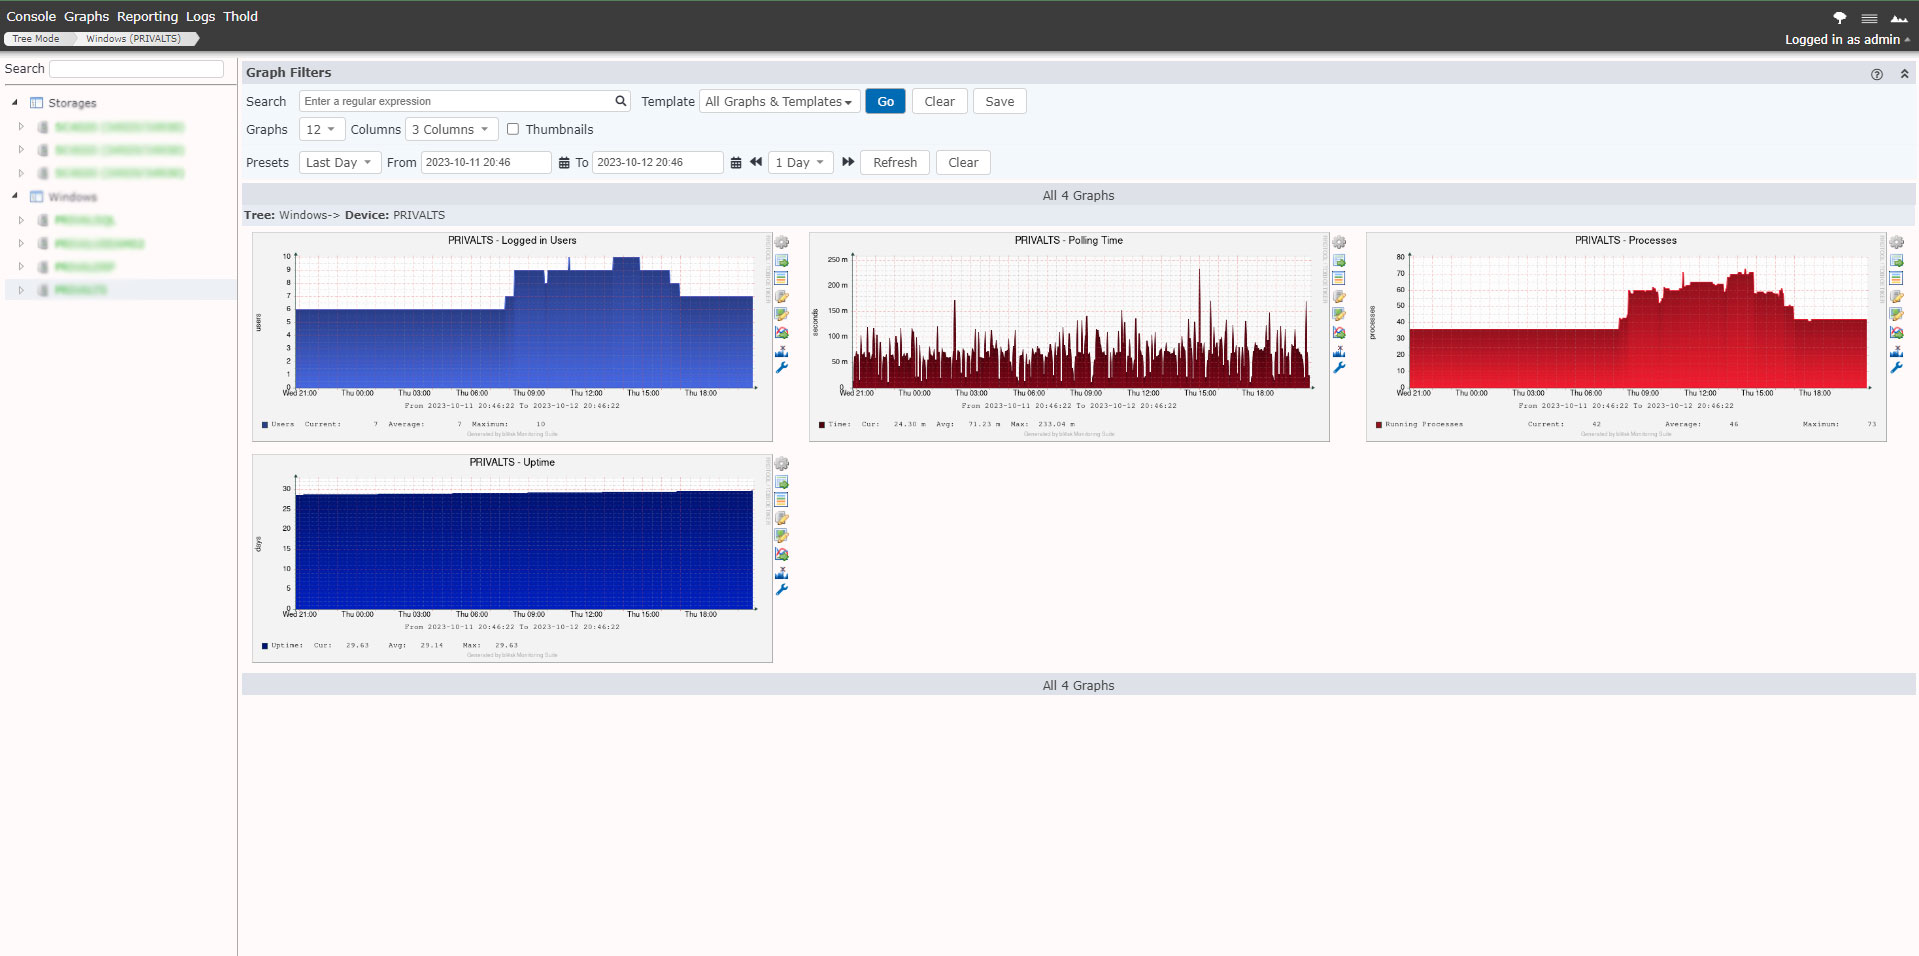
blësk NPM creates a service-oriented view of your IT infrastructure and identify the main network problems. It automatically detects, maps and monitors all devices on a network and presents graphs and interactive linear tables. Thanks to innovative technologies integrated in NPM, your IT team can query services at predetermined intervals and can graph the resulting data.
An automated cycle of 3 steps:
- Collection of data
- Calculation of algorithms
- Results in differents views

An Optimal and Healthy Network
blësk NPM is typically used to plot metric data over time, such as CPU load and network bandwidth usage.
In summary, blësk NPM offers you:
- A performance analysis dashboard;
- A view of the loss and latency of different devices;
- Unlimited graphic elements;
- Manipulation of graphical data;
- A health status of the network.

